Heart Rate Variability Profile As Fingerprint
Kristen Sparrow • June 02, 2014

My manuscript is submitted to Medical Acupuncture as of last Friday night (yay.) (Update: Came boomeranging back with a bunch of changes I have to make. grrr. Another few hours of my life I will never get back) As a brief reminder, what I’ve found so far is that if you compare a patient’s initial response to needling (their first 5 minutes to the second 5 minutes) what you tend to find is a decrease in their stress response, which in turn correlates with positive clinica
l outcomes. So this is interesting in and of itself, but the real point of this is to guide treatment, to provide better treatment. Does their HRV change with different acupoints? With all the research on the varied responses to different acupoints, this would certainly suggest “yes,” but needs to be shown. Does auricular acupuncture change their HRV response? Does electroacupuncture? Does the absolute number of needles?
But the point of this blog post is the fascinating ph
enomenon that patients’ HRV profiles tend to follow individual patterns. That is, they tend to have an individual, and almost unique profile to needling, almost like a fingerprint. I’m trying to optimize the profile within the parameters I’ve set, but I still find it absolutely remarkable how consistent the patterns are. It might be difficult for the reader to see this.
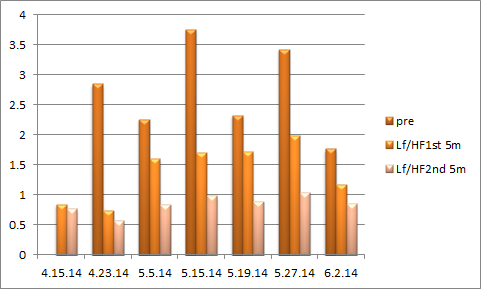
Looking at one outlier, a patient receiving acupuncture for hypertension, her blood pressure has remained controlled, but her HRV profile is that of a nonresponder. What I mean is that her HRV has not gone down over time, nor is there a response during treatment, and to add another parameter to the mix, her Pre HRV versus, intratreatment HRV is not favorable either. This is with or without electro, with or without poin
ts on the head. Here is her data with the pre and intra.
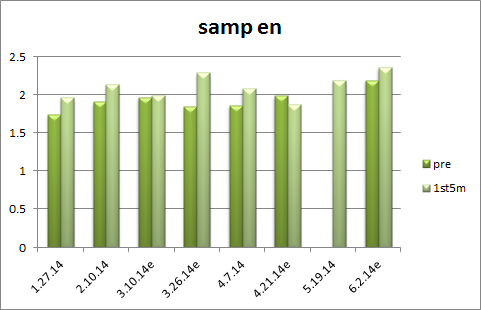 This data looks at Sample Entropy, another measure of variability. In most cases the variability increased from pre to intra, showing increased variability, though her LF/HF did not show the same thing. Data on the left.
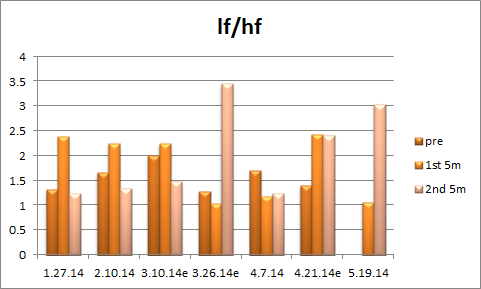
I will also include data on a patient receiving acupuncture for fertility. Notice how her individual pattern is fairly uniform with the stress profile decreasing from Pre to 1st 5m to 2nd 5min segment. Why is that? What is this showing about their physiology (if anything)?

