Heart Rate Variability as a Measure of Response to Acupuncture Treatment
Kristen Sparrow • February 25, 2019

 You may need to bear with me here. This data is from a new patient who came in for the first time last week. He has had severe anxiety compounded by the fact that he has a chaotic sleep schedule.
His date illustrates some of the subtleties and complexities of Heart Rate Variability (HRV) analysis. HRV is a calculation of the the variation of a patient’s heart rate with breathing. The more variable the “healthier” the person. But it’s not quite that simple. HRV can go down with age, stress, and illness. This patient is an extremely fit 53 year old. He plays basketball daily. And his overall HRV as measured in time shows this. His RMSSD is from 30 to 45, his pnn50 is from .06 to .13. These values show a middle range in HRV, but quite good for his age. I have noticed that patients with values in this range, often show the most relevant change in their HRV as measured by the SampEn, or Sample Entropy. Also, of note is that usually, all of the HRV parameters correlate with one another, all showing the same response ie if the LF/HF shows a decrease in stress the DFAα1 will also. But sometimes they don’t all correlate or show the same degree of response. So which parameter is the one to trust? This case is one of those cases and interesting in a geek sense.
This case shows that you need to pick the parameter that is most relevant to the individual patient before you can draw any conclusions. The sympathetic data and DFAα1 data would argue that he didn’t have much of a response. But the LF/HF and SampEn argue that he did.
So as an exercise I’ll show you all of his data graphed from his first treatment.
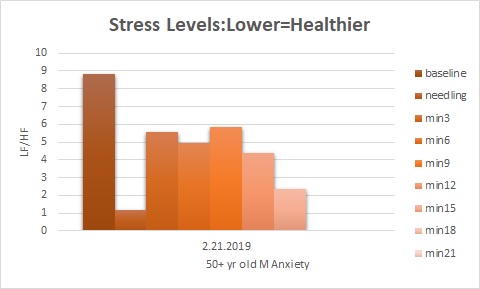
This is LF/HF or sympathetic/parasympathetic data. This is usually a useful snapshot of stress levels and response. His initial reading is high. It decreases with needling which is called an “orienting” response. But it bounces back up and then decreases. These are high values. His stress and anxiety are on full display here. But the decrease from 5 to 2 is a positive sign, as is the “orienting” response.
This next graph (pardon the typos, too lazy to fix) is his Sample Entropy. As you can see, it doesn not correlate with the LF/HF and shows a positive response with needling, which is favorable 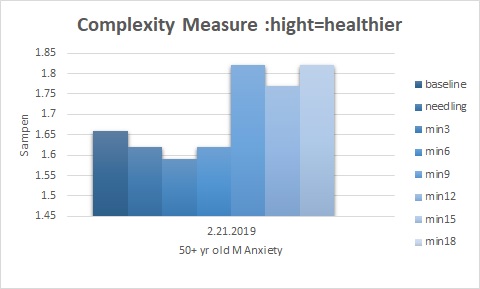
The next data is his parasympathetic activity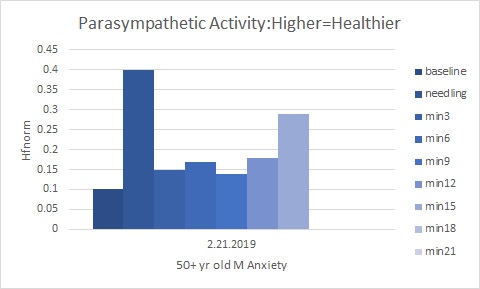 . This mirrors the LF/HF above, which is predicted since it’s part of that calculation.
It shows a spike during needling, the orienting response and then an increase during treatment. Favorable again.
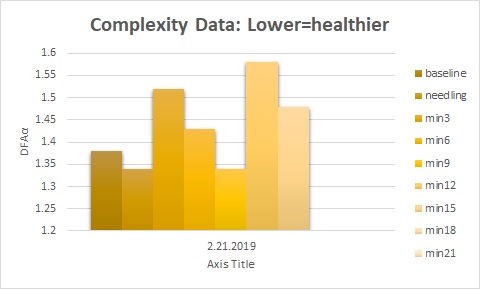
This next data is his DFAα1. This parameter can be extremely useful in patients who have very high initial HRV as measured by their RMSSD and Pnn50. In this case it doesn’t really correlate at all with the other data. I feel comfortable ignoring this data because of the above.
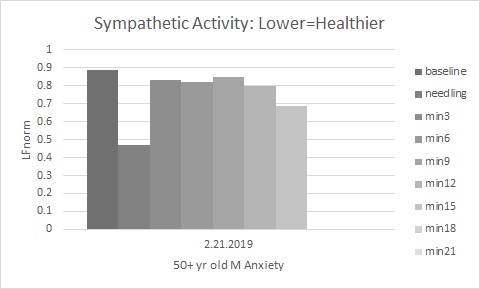
The final data is his sympathetic activity data. This is the other parameter in the ratio of LF/HF yet tells a different story. Here you see an “orientation” response, but then not much change.