
Each group of bars represents a treatment date. Each bar represents 3 minutes of stress data, the smaller the bar, the less the stress. The dark blue bar is the needling segment, if it is missing, then monitoring was started after needling. Ideally, I like to see the stress decrease during treatment after needling and over time.
Just to sh ow you a few of the “stories” generated by HRV (stress) data in the clinic.
This shows the data from a healthy 33 year old female with hypertension, an ideal candidate for HRV monitoring since hypertension is related to stress response. Notice how her stress comes down when I carefully monitor how she does with different treatment protocols, and then repeat the “winning” ones? Good, even beautiful data!
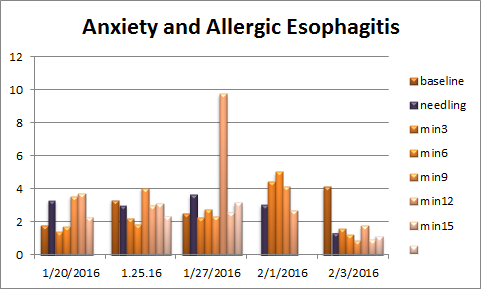 Here’s another one showing a patient with moderately severe anxiety which has gotten significantly better since her first treatment 1.20.16. Nice data, but too messy to be “beautiful.”
 One more showing how different protocols can affect stress profile. Keep in mind the dark blue bars are the needling segment. So in the treatment on 2.3.15 you can see the large spike in stress with the needling of Kidney 1 on the bottom of the foot, but look afterwards at the profound decrease. Beautiful data!

